Lab 1: Mental Rotation
from IPython.core.display import HTML, Markdown, display

import numpy.random as npr
import numpy as np
import pandas as pd
import seaborn as sns
import matplotlib.pyplot as plt
import scipy.stats as stats
import statsmodels.formula.api as smf
import ipywidgets as widgets

import os

Lab 1: Mental Rotation#
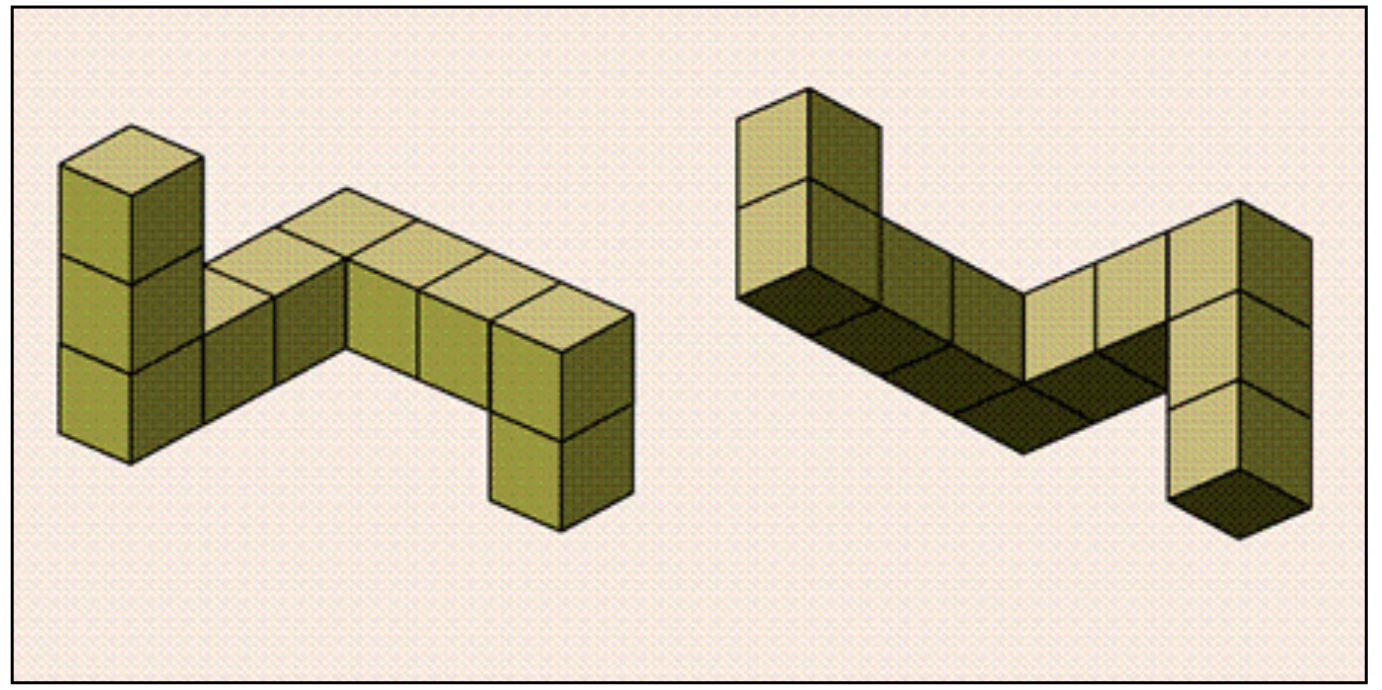
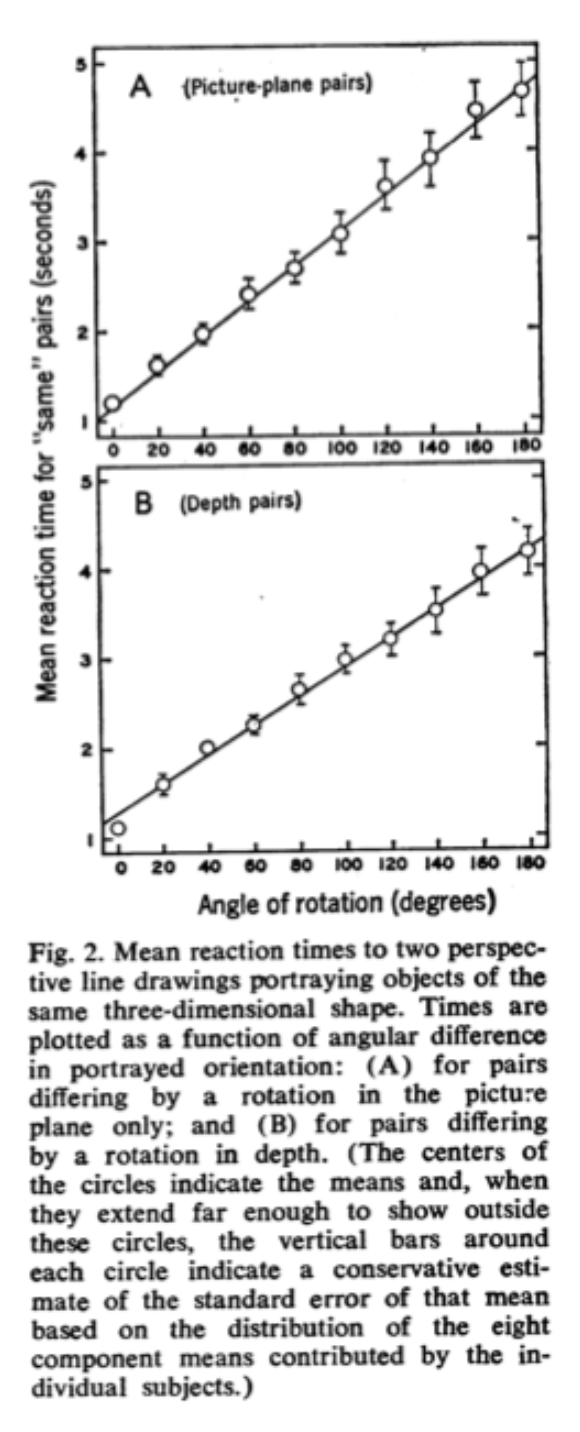
As described in the reading, in the Shepard & Metzler (1971) experiments, the time it took people to decide if an object was the same (just rotated) or different (a mirror reflection) depended on the angle of rotation:

In other words, it would take you longer to decide if the 30 degree rotated version of your cup was the same as the upright version relative to the 15 degree rotated version. The idea is that in order to make the same/mirror judgement, people actually mentally rotate the object. Bigger angles require more time to “rotate” in your mind just as they would in the real world (see Figure below). As mentioned in class, Cooper (1976) performed an even more interesting followup which provided even stronger evidence that people rotate objects when doing the matching task. Thus, most people agree that people do seem to perform some kind of mental rotation.
Picking up from last time, read in all the files from the lab session and combine them into one larger pandas data frame using the `pd.concat()` command. Or you can simply read the combined file that you saved at the end of the last lab session.
# this is an example list comprehension which reads in the all the files.
# the f.startswith() part just gets rid of any junk files in that folder
filenames=['lab1-data/'+f for f in os.listdir('lab1-data') if not f.startswith('.')]
Delete this text and put your answer here. The code for your analysis should appear in the cells below.
The data from our experiment is conceptually a replication of this paper using the same stimuli. Jump to the methods section of this paper and determine what quality control measures they applied to their data. For instance what kind of trials were analyzed and which were excluded. Where there any basis for excluding an entire participant? In a markdown cell describe the set of exclusion criterion that the authors used. Next, create a new data frame of the data from our experiment applying the same exclusion criterion.
Delete this text and put your answer here. The code for your analysis should appear in the cells below.
Use the pandas 'groupby' function to compute the average reaction time as a function of the angle of the stimulus. It may help to go back to the notebook on dataframes and plotting and searching for the groupby example.
Delete this text and put your answer here. The code for your analysis should appear in the cells below.
Use the pandas 'groupby' function to compute the average accuracy per participant. Again, it may help to go back to the notebook on dataframes and plotting and searching for the groupby example.
Delete this text and put your answer here. The code for your analysis should appear in the cells below.
Together question 3 and 4 allow you to essentially re-create Table 1 from the paper. Recreate this table for our dataset using a pandas dataframe. Although this table has a heirarchical, two layer column label it is fine if you just label the columns using "Mean RT" and "Mean error", etc...
Delete this text and put your answer here. The code for your analysis should appear in the cells below.
Using the seaborn 'scatterplot()' function (docs), create a plot of angle versus reaction time collapsing across all the subjects in the task. You should restrict you analysis the same trials that were analyzed in the target reading.
Delete this text and put your answer here. The code for your analysis should appear in the cells below.
As you have seen the regplot() and scatterplot() types in seaborn are quite related. Replot the data from above this time using regplot so you can get a sense of the best fit regression line fit to the overall dataset. Again, you should restrict you analysis the same trials that were analyzed in the target reading.
Delete this text and put your answer here. The code for your analysis should appear in the cells below.
Using the statsmodels ordinary least squares regression peform a regression of angle (predictor) onto reaction time (outcome) for the entire class data. Compare the cofficients you obtained to the ones reported in the results section of the paper.
Delete this text and put your answer here. The code for your analysis should appear in the cells below.
Although in the previous step we might see evidence of the increase of reaction time with angle we averaged across a number of other relevant aspects of our data frame. For instance we averaged across both the subjects (participants column) and the type of stimuli (if it was 'same' or 'different' - this is in the 'corrAns' column). Using the example groupby command displayed in class, find the average reaction time as a function of angle and same/different for each individual subject.
Delete this text and put your answer here. The code for your analysis should appear in the cells below.
Using the dataframe you constructed in the last step recreate Figure 3 from the paper. Hint: the plot in Figure three is akin to the 'catplot' in seaborn. Consult the seaborn documentation for information on this plot type.
Delete this text and put your answer here. The code for your analysis should appear in the cells below.
The analyses we have considered so far combine across subjects. However we would often like to analyze the effect in terms of individuals. Does every individual show this pattern or only some? Let's approach this two ways. One, graphically by making a plot of every individual subject. Two, analytically but running a separate regression model for each subject. For the plot use the seaborn `regplot`. Some code is provided to show and example of iterating with a for loop over individual subjects in the data frame.
Delete this text and put your answer here. The code for your analysis should appear in the cells below.
This gives a list of all the unique subjects in our data frame
all_df.participant.unique()
array(['todd', 'db12', 'MC24', 'iw44', 'SK36', 'nd24', 'si13', 'so30',
       'AB29', 'bk90', 'Monishee Matin', 'j98', 'kc10', 'ml98', 'vt15',
       'Cc01', 'de24', 'ek87', 'pr27', 'kd27', 'JL29'], dtype=object)
This selects only the data from the second subject (db12)
subs = all_df.participant.unique()
print(len(subs))
part_df=all_df[all_df.participant==subs[1]]
part_df.head()
21
| trialResp.keys | trialResp.corr | trialResp.rt | loop.thisRepN | loop.thisTrialN | loop.thisN | loop.thisIndex | loop.ran | loop.order | imagefile | corrAns | angle | participant | session | date | expName | psychopyVersion | frameRate | |
|---|---|---|---|---|---|---|---|---|---|---|---|---|---|---|---|---|---|---|
| 0 | s | 1 | 2.970 | 1 | 0 | 100 | 36 | 1 | 99 | i17_50.jpg | s | 50 | db12 | 1 | 2019-10-16_10h07.25.323 | MentalRotationFinal | 3.1.2 | 60 |
| 1 | s | 1 | 5.654 | 1 | 0 | 100 | 11 | 1 | 99 | i5_100.jpg | s | 100 | db12 | 1 | 2019-10-16_10h07.25.323 | MentalRotationFinal | 3.1.2 | 60 |
| 2 | d | 1 | 7.175 | 1 | 0 | 100 | 93 | 1 | 99 | i43_100_R.jpg | d | 100 | db12 | 1 | 2019-10-16_10h07.25.323 | MentalRotationFinal | 3.1.2 | 60 |
| 3 | s | 1 | 2.922 | 1 | 0 | 100 | 77 | 1 | 99 | i35_150.jpg | s | 150 | db12 | 1 | 2019-10-16_10h07.25.323 | MentalRotationFinal | 3.1.2 | 60 |
| 4 | d | 1 | 4.004 | 1 | 0 | 100 | 96 | 1 | 99 | i45_100_R.jpg | d | 100 | db12 | 1 | 2019-10-16_10h07.25.323 | MentalRotationFinal | 3.1.2 | 60 |
This plot reaction time as a function of angle separately for the same and different trial for this one participant.
for i,s in enumerate(subs):
    print(i)
    part_df = all_df[all_df.participant==s]
    print(part_df.head())
    print('----')
    print()
In your own word summarize the results of the analyses you conducted above. Specifically you should mention what the regresssion results imply about the data. How consistent is the pattern across subjects? Does the experiment we ran in class replicate the finding in the target paper?
Delete this text and put your answer here. The code for your analysis should appear in the cells below.

